Description of the datasets
The dataset includes the number of COVID-19 tests performed (respectively positive tests) in the city laboratories by department, sex and age category. The data span two periods
- during the first lockdown (March 10 to May 26, 2020) . Data collected from https://www.data.gouv.fr/fr/datasets/donnees-relatives-aux-tests-de-depistage-de-covid-19-realises-en-laboratoire-de-ville/
- after the first lockdown (May 13 to September 12, 2020). Data collected from https://www.data.gouv.fr/fr/datasets/donnees-relatives-aux-resultats-des-tests-virologiques-covid-19/
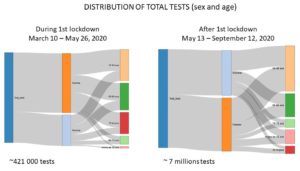
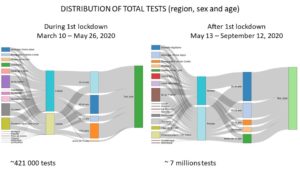
1. Total tests
Distribution across sex and age
Distribution across region, sex and age
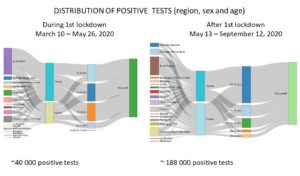
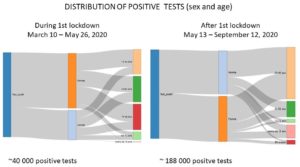
2. Positive tests
Distribution across sex and age
Distribution across region, sex and age